Kvantifikace karantény
Simulace šíření zombie nákazy na skutečné mapě zalidnění.
Popis projektu i demo jsou zatím jen v angličtině.
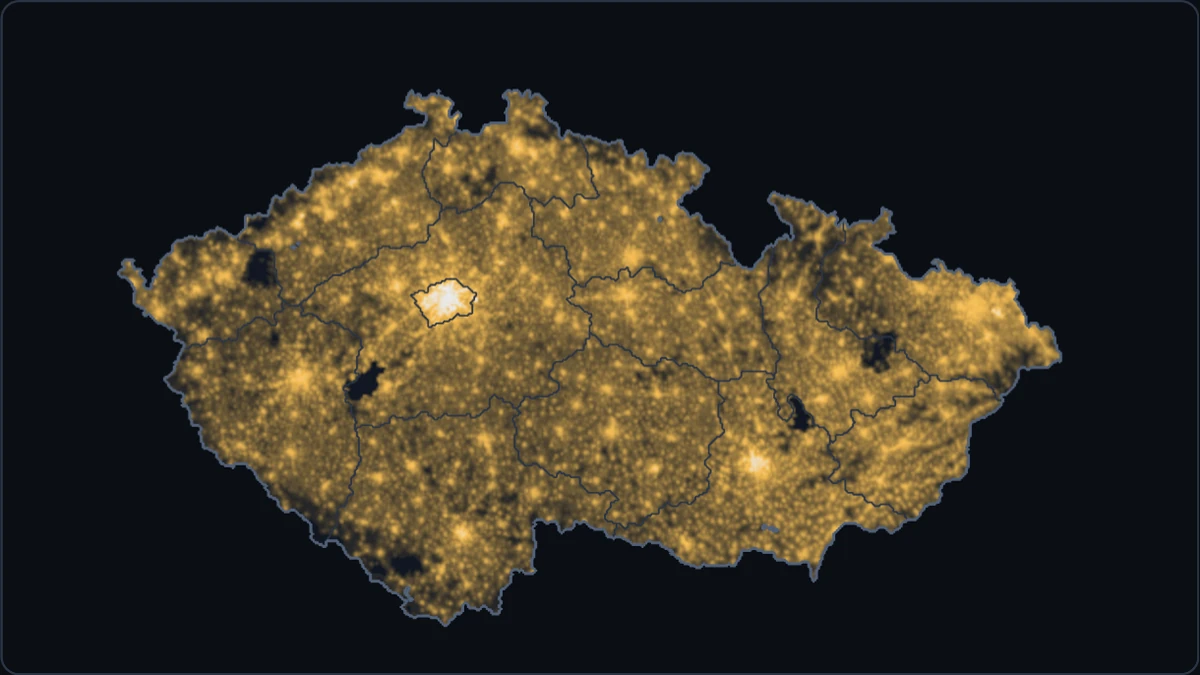
A zombie outbreak on a population map of Czechia, one square kilometre to a pixel. The outbreak starts in Prague, Brno or Ostrava. Nobody notices it for a week. Then one crew starts building whatever cordons you have drawn, and the demo counts how many people that saves compared with doing nothing.
The model
The outbreak follows the humans–zombies–removed (SZR) model of Munz, Hudea, Imad and Smith? (2009). Humans (S) are bitten and become zombies (Z). Humans destroy zombies, which join the removed (R). The removed can rise again as zombies. The paper also has births and natural deaths; the demo leaves them out, since a run lasts a year.
The paper’s population is well mixed: everyone can meet everyone. On the map, every square kilometre runs the same equations, and people move between neighbouring squares:
∂S/∂t = −β S Z + ∇·(χ S ∇z)              humans are bitten, and flee from zombies
∂Z/∂t =  β S Z − α S Z + ζ R + D ΔZ       zombies bite, are destroyed, rise and wander
∂R/∂t =  α S Z − ζ R                      where z = Z / (S + Z) is the zombie share
Three choices shape what happens.
- Densities. S, Z and R are people per square kilometre, and encounters are mass action (βSZ), so crowded places fall faster. In Prague’s most crowded square kilometre, about 4,900 people, one zombie bites about 46 people a day at the paper’s rate. Cities fall within days; the countryside holds out for weeks.
- Movement. Zombies wander at random (diffusion, D). Humans flee from squares where zombies are a larger share of everyone walking around (χ). Using the share rather than the number of zombies keeps the flight bounded however dense the zombies get.
- A cutoff. In a square kilometre with fewer than one zombie, zombies can’t bite. Without this, the equations spread tiny fractions of a zombie everywhere, those fractions grow, and no cordon could hold: a thousandth of a zombie would seep through any gap and start again on the other side. Brunet and Derrida (1997) studied this kind of cutoff for spreading fronts. It stands in for the fact that zombies come whole.
The strains are illustrative settings, not estimates. Munz et al. (2009) uses the paper’s rates (β = 0.0095, α = 0.005, ζ = 0.0001), reading its population of 500 as 500 people per square kilometre. That reading is a judgement call: the paper counts people in a well-mixed group, not per area. Shamblers are slower, Frenzied are faster, and Risers lose most fights but rise again within days.
Each step of a tenth of a day applies the bites, the wandering, the fleeing and a clean-up, in that order. The bites use an exponential form that can’t push any count below zero. The wandering step is kept at D·dt ≤ 0.2, below the textbook stability limit of 0.25: at that limit a checkerboard pattern flips sign every step without dying away, and it showed up on the map as hatching. The browser’s solver is a port of a NumPy reference model, and its tests check that the two agree to within about 1 part in 10¹⁴.
The map
The population is WorldPop’s 2020 estimate for the Czech Republic at 30 arc-seconds, adjusted to the UN’s national total. Those cells aren’t square kilometres. At 50°N, 30 arc-seconds is about 0.93 km north to south but only 0.60 km east to west, so a cell covers about 0.55 km². Treating each cell as a square kilometre would count 19.3 million people instead of 10.75 million, and stretch the map sideways. The demo resamples the data onto an equal-area 1 km grid (ETRS89-LAEA), which keeps the total exactly. Region and national borders come from Natural Earth.
The quarantine
The outbreak is hidden until day 7: until then the map shows nothing amiss. You can plan at any time, by drawing cordons freehand or by sealing whole regions, but one crew builds everything, in the order you planned it, at 40 km a day from day 7.
On the grid, people and zombies move between neighbouring squares across the edge they share. So a cordon is a chain of square edges, and each edge is 1 km of fence. A freehand stroke is snapped onto the grid lines, so it has no gaps, and nothing crosses it once it’s built. Sealing a region closes its borders with the other regions, but not its national border: zombies that cross into Germany, Poland, Austria or Slovakia leave the model, counted as exported.
The same outbreak with no quarantine runs alongside, which is how the demo knows how many people your quarantine saved. It also counts the people you sealed in: those inside an area cut off from the rest of the country while it held zombies able to bite, at the moment it closed.
What the trials showed
The detection day and the crew’s speed were chosen by trial, with a plan drawn the moment the outbreak is detected: a ring around the starting city, some margin beyond the visible outbreak, or a straight line across the country beyond it. Like the strains, these settings are illustrative.
- Cities fall before anyone notices. At the paper’s rates, 1.43 million people have been bitten by day 3, more than live in Prague itself (1.34 million on this map). By day 7, zombies are 17 to 44 km from where they started, depending on the city and the strain. Sealing the starting region holds around Ostrava against every strain except Frenzied, around Brno only against Risers, and around Prague never: Prague’s own region is only about 13 km in radius.
- The crew has to outbuild the front about eight times over. A ring that follows the grid lines around a circle of radius r is 8r long, as long as the square around the circle. The front then moves about 1.5 km a day at the paper’s rates and 3.3 km a day for Frenzied zombies (measured from Prague). At 40 km a day, a ring around Prague holds the paper’s strain if it starts at least 20 km beyond the visible outbreak, and then 8.2 million people survive. Frenzied zombies need a ring 65 km out, which saves 5.2 million: about as many as a straight line across the country that gives up the west.
- All or nothing. Every ring either held completely or failed completely. When one failed, only 20,000 to 60,000 people were left on day 365, about as many as with no quarantine.
- Geography matters. Ostrava sits in a corner against Poland and Slovakia, so half of any ring around it lies outside Czechia and costs nothing. Every strain can be contained there. Prague, in the middle, is the hard case.
Survivors on day 365, out of 10.75 million, with the plan drawn on day 7:
| Strain, city | Narrowest ring that held | A ring 10–20 km tighter | Line across the country | No quarantine |
|---|---|---|---|---|
| Munz et al., Prague | 20 km out: 8.17M | 10 km out: 0.02M | 5.33M | 0.02M |
| Frenzied, Prague | 65 km out: 5.17M | 45 km out: 0.06M | 5.08M | 0.02M |
| Frenzied, Brno | 30 km out: 8.96M | 20 km out: 0.02M | 6.54M | 0.02M |
| Frenzied, Ostrava | 10 km out: 9.56M | 8.91M | 0.02M |
These trials are a best case: the simulated planner draws a perfect circle the moment the outbreak shows. At 1×, each second spent drawing costs two days, unless the run is paused.
Limits
- The rates, the detection day and the crew’s speed are illustrative, chosen so a quarantine can work but has to be quick. They aren’t estimates of anything.
- The model is deterministic. The same plan always gives the same result: there is no luck, and no lone zombie slipping through.
- Nobody is born or dies of other causes, humans never leave Czechia, and zombies that cross the border are counted but not followed.
- Humans only flee. They don’t commute, travel or organise, and at 1 km a town is a handful of squares.
Credits
- Munz, P., Hudea, I., Imad, J. and Smith?, R. J. (2009). When zombies attack!: Mathematical modelling of an outbreak of zombie infection. In Infectious Disease Modelling Research Progress, pp. 133–150. Nova Science.
- Brunet, É. and Derrida, B. (1997). Shift in the velocity of a front due to a cutoff. Physical Review E 56, 2597–2604.
- Population: WorldPop, Czech Republic 2020, UN-adjusted, 1 km (CC BY 4.0). WorldPop (www.worldpop.org - School of Geography and Environmental Science, University of Southampton; Department of Geography and Geosciences, University of Louisville; Departement de Geographie, Universite de Namur) and Center for International Earth Science Information Network (CIESIN), Columbia University (2018). Global High Resolution Population Denominators Project - Funded by The Bill and Melinda Gates Foundation (OPP1134076).
- Borders: Natural Earth, 1:10m (public domain).